


Overview
Memory is a valuable resource in software development, especially within the Android ecosystem, where physical memory is often constrained. With the growth of the mobile markets, there are a variety of devices from low-end to high-end. We need to consider that not every phone is a premium and has a lot of memory available. Manages memory efficiently is an ongoing challenge for developers to make a good, scalable app. This article will introduce how the Android system manages memory and the evolution of the Android Runtime over the years.
Java Heap Memory and Stack Memory
Java applications are compiled and executed in the RAM of the device. To keep the application memory lean, the Java Virtual Machine (JVM) divides the memory requirements of an application into different sections, including Heap Space and Stack Memory.
Stack memory
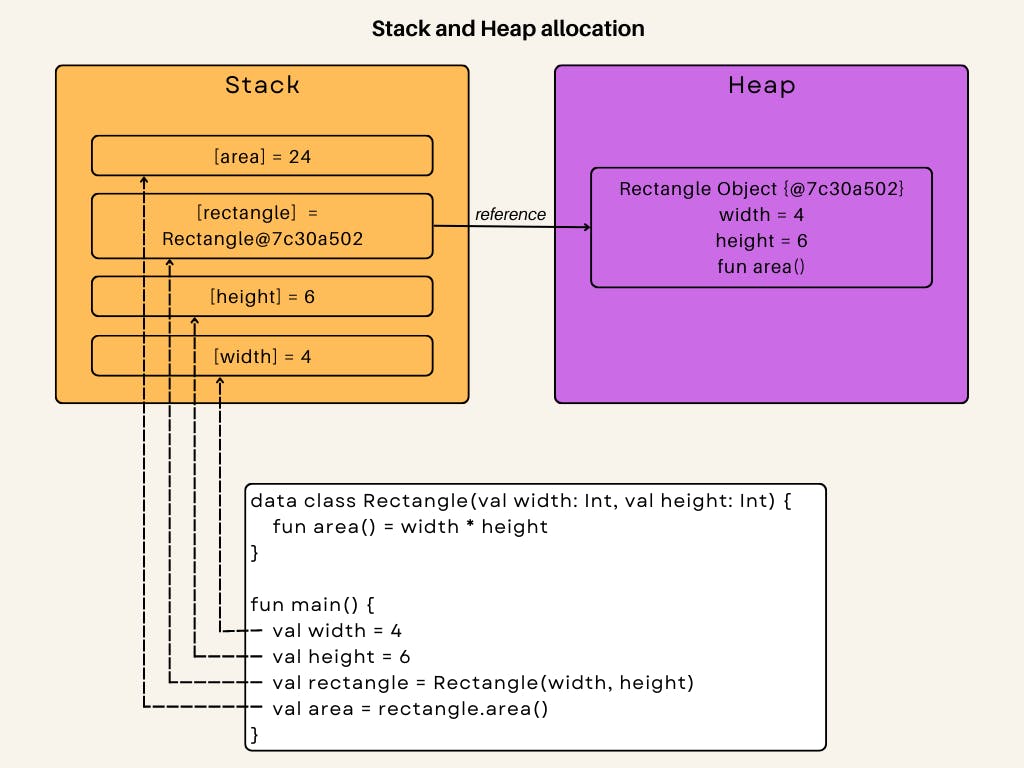
Stack memory is a memory space used to store temporary data when a method is executed. It is accessed in a Last-In-First-Out (LIFO) order. When a method is invoked, a new block of memory is created on top of the stack to hold local primitive values and reference to other objects. Notes that Stack memory only contains the reference to the object, the object itself will be stored in a heap. As soon as the method completes, the block is cleared and popped out of the call stack. The empty block becomes available for the next method to use. Stack memory size is significantly less compared to heap memory.
Heap space
Heap memory is used to store the objects that are created during the execution of a program. Any object created in the heap space has global access and can be referenced anywhere in the application. Android sets a hard limit on the heap size allocated for each app. If your app has reached the heap capacity and tries to allocate more memory, the system throws an OutOfMemoryError.
Garbage Collector - The hero that we need
In a low-level language like C or C++, developers can manually manage memory allocation. This gives us much more power to control the lifetime of every object that is created in the application. But “with great power comes great responsibility”, forgets to free memory will lead to memory leaks. As the application grows bigger and bigger, managing memory became more and more tedious, and the more likely you are to make mistakes. Java has an automatic memory management mechanism that helps us with this headache, which is known as Garbage Collection (GC).
Garbage Collection keeps track of each memory allocation and frees it back to the heap when it is no longer being used, without the programmer's intervention. The principle of GC is to find objects that can’t be accessed and reclaim the resource from them. When talking about GC, we need to care about several things:
- How long do the allocation and collections take?
- How efficient is heap usage?
- How frequently is this process happen, and how does it affect the app performance?
A little bit of history
In the early days of Android, smartphones run on very little memory and multiple programs can run at once. The first Android Runtime, called Dalvik, is originally optimized for resource-constrained systems. Dalvik is designed to prioritize RAM size more than speed, so memory allocation on Dalvik is relatively slow. Therefore, everyone is recommended to avoid allocation whenever possible. Other recommendations included things like staying away from enums, using primitive types to avoid autoboxing…
Let's see how GC works in the Dalvik.
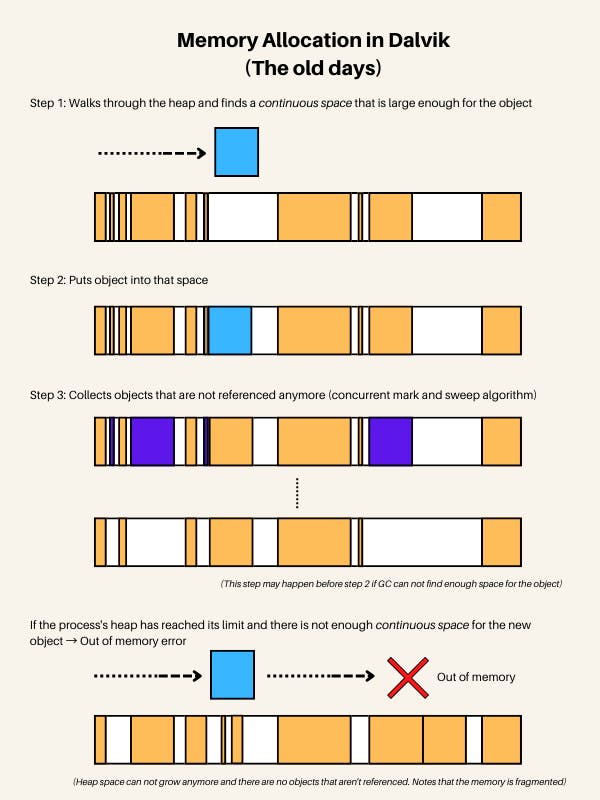
When an object needs allocation, GC walks across the heap and finds a continuous space that is large enough for the object and put it into that space. As the heap begins to fill up, garbage collection will be triggered to free up memory. Collection is a several phases process, using the mark-and-sweep algorithm:
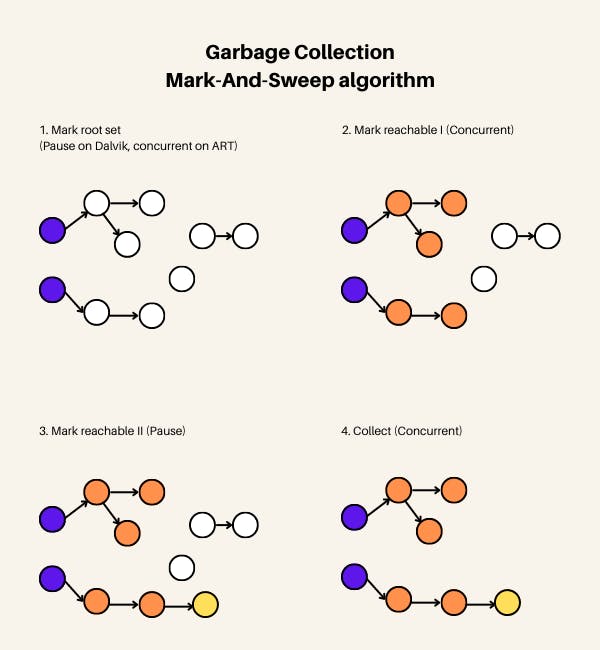
Phases 1 - Mark root set: In this phase, GC pauses all the threads to find objects that are referenced directly from the application or system code. During this time, all the threads in the system are stopped to prevent referencing anything new.
Phase 2 - Mark reachable I: GC marks all objects that are reachable from the root set or indirectly referenced from one of those objects. After that, GC will figure out which objects in the heap are alive. This phase is concurrent, so the application can run normally.
Phase 3 - Mark reachable II: Since at phase 2 the app is running again, another object can be allocated in the meantime. So GC goes through the heap again and finds newly allocated objects. This time it will pause all the threads.
Phase 4 - Collect: GC reclaims memory from objects that have not been marked as live. This phase is concurrent.
What happens after collecting and there is still not enough memory to allocate a new object? When GC fails to allocate more memory, there are two scenarios:
- The heap continues to grow if it has not reached its limit.
- If the heap is at the max size already, Out of Memory Error occurs and the app crashes.
A new dawn
Dalvik worked fine for a couple of years, but it had gone as far as it could as optimizations. Especially when mobile devices got more and more RAM, Dalvik’s limitation was becoming more of a problem. In Android L there was a new Android Runtime introduced with a lot of improvements: ART. It was written for performance from the beginning because it is not suffering from memory constraints like the Dalvik.
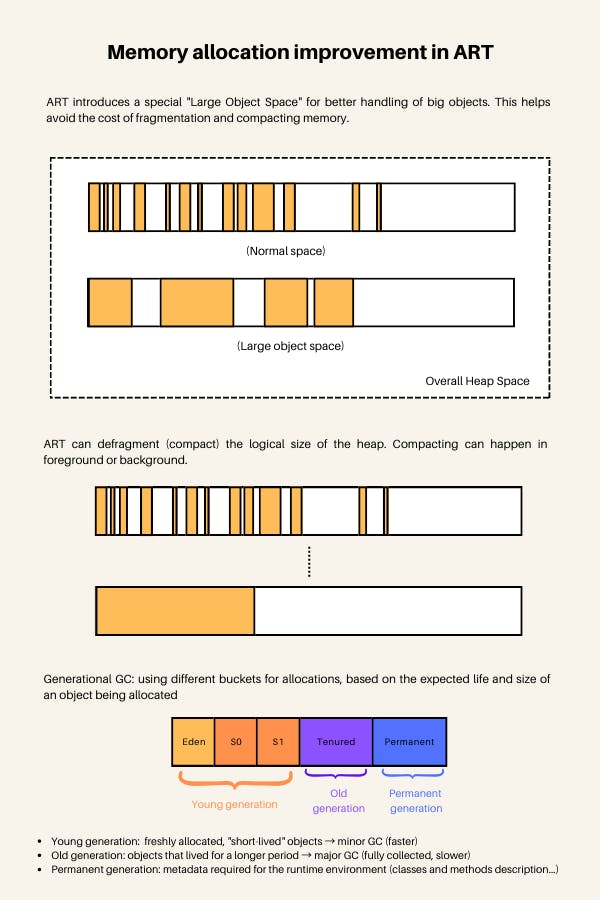
Garbage Collection in ART is able to do thread-local allocation, which eliminates a lot of the pause. The next improvement is that GC now handles fragmentation much better. It has a separate space for huge objects and can compact the heap. The compacting process is often done in the background, but it can also happen in the foreground when necessary.
Finally, GC in ART is still using the “Concurrent Mark-and-Sweep” algorithm like before, but with some enhancements: Generations. Based on the expected life and size of an object being allocated, it is classified into different “generations”. Recently allocated objects belong to the Young generation. When an object stays active long enough, it can be promoted to an older generation, followed by a permanent generation. Each heap generation has its own dedicated upper limit on the amount of memory that objects there can occupy. Any time a generation starts to fill up, the system executes a garbage collection event in an attempt to free up memory. GC will only collect from a specific generation if necessary, so it saves a lot of time.
Summary
The Android world has come a long way since its beginnings. We now have faster, better and more performed devices with a lot of improvements in the platform itself. Even though memory limitation is no longer a big problem like it used to be, we should always use it efficiently. If you want to learn more about memory allocation in Android, I recommend this talk from Chet Haase: Trash Talk: The Evolution of Android Garbage Collection
That’s all for now. Thanks for reading!
Source
Trash Talk: The Evolution of Android Garbage Collection - DevFest OnAir 2018
Collecting the Garbage: A brief history of GC over Android versions